International Federation of Red Cross and Red Crescent Societies: Forecasts in Context
This collection of maps provides information that can be used for humanitarian decision-making around the world, developed by the IRI and the IFRC. It also provides information on the types of early action that can be taken based on these maps.Click the tabs (top right) for links to the following useful maps:
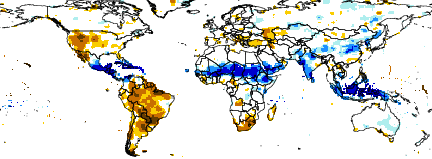
- Six-Day forecasts: These maps show where heavy rainfall is expected in the next six days, and how much rainfall is expected.
- Three-Month Forecasts: These maps show where large or small amounts of rainfall are expected in the next three months.
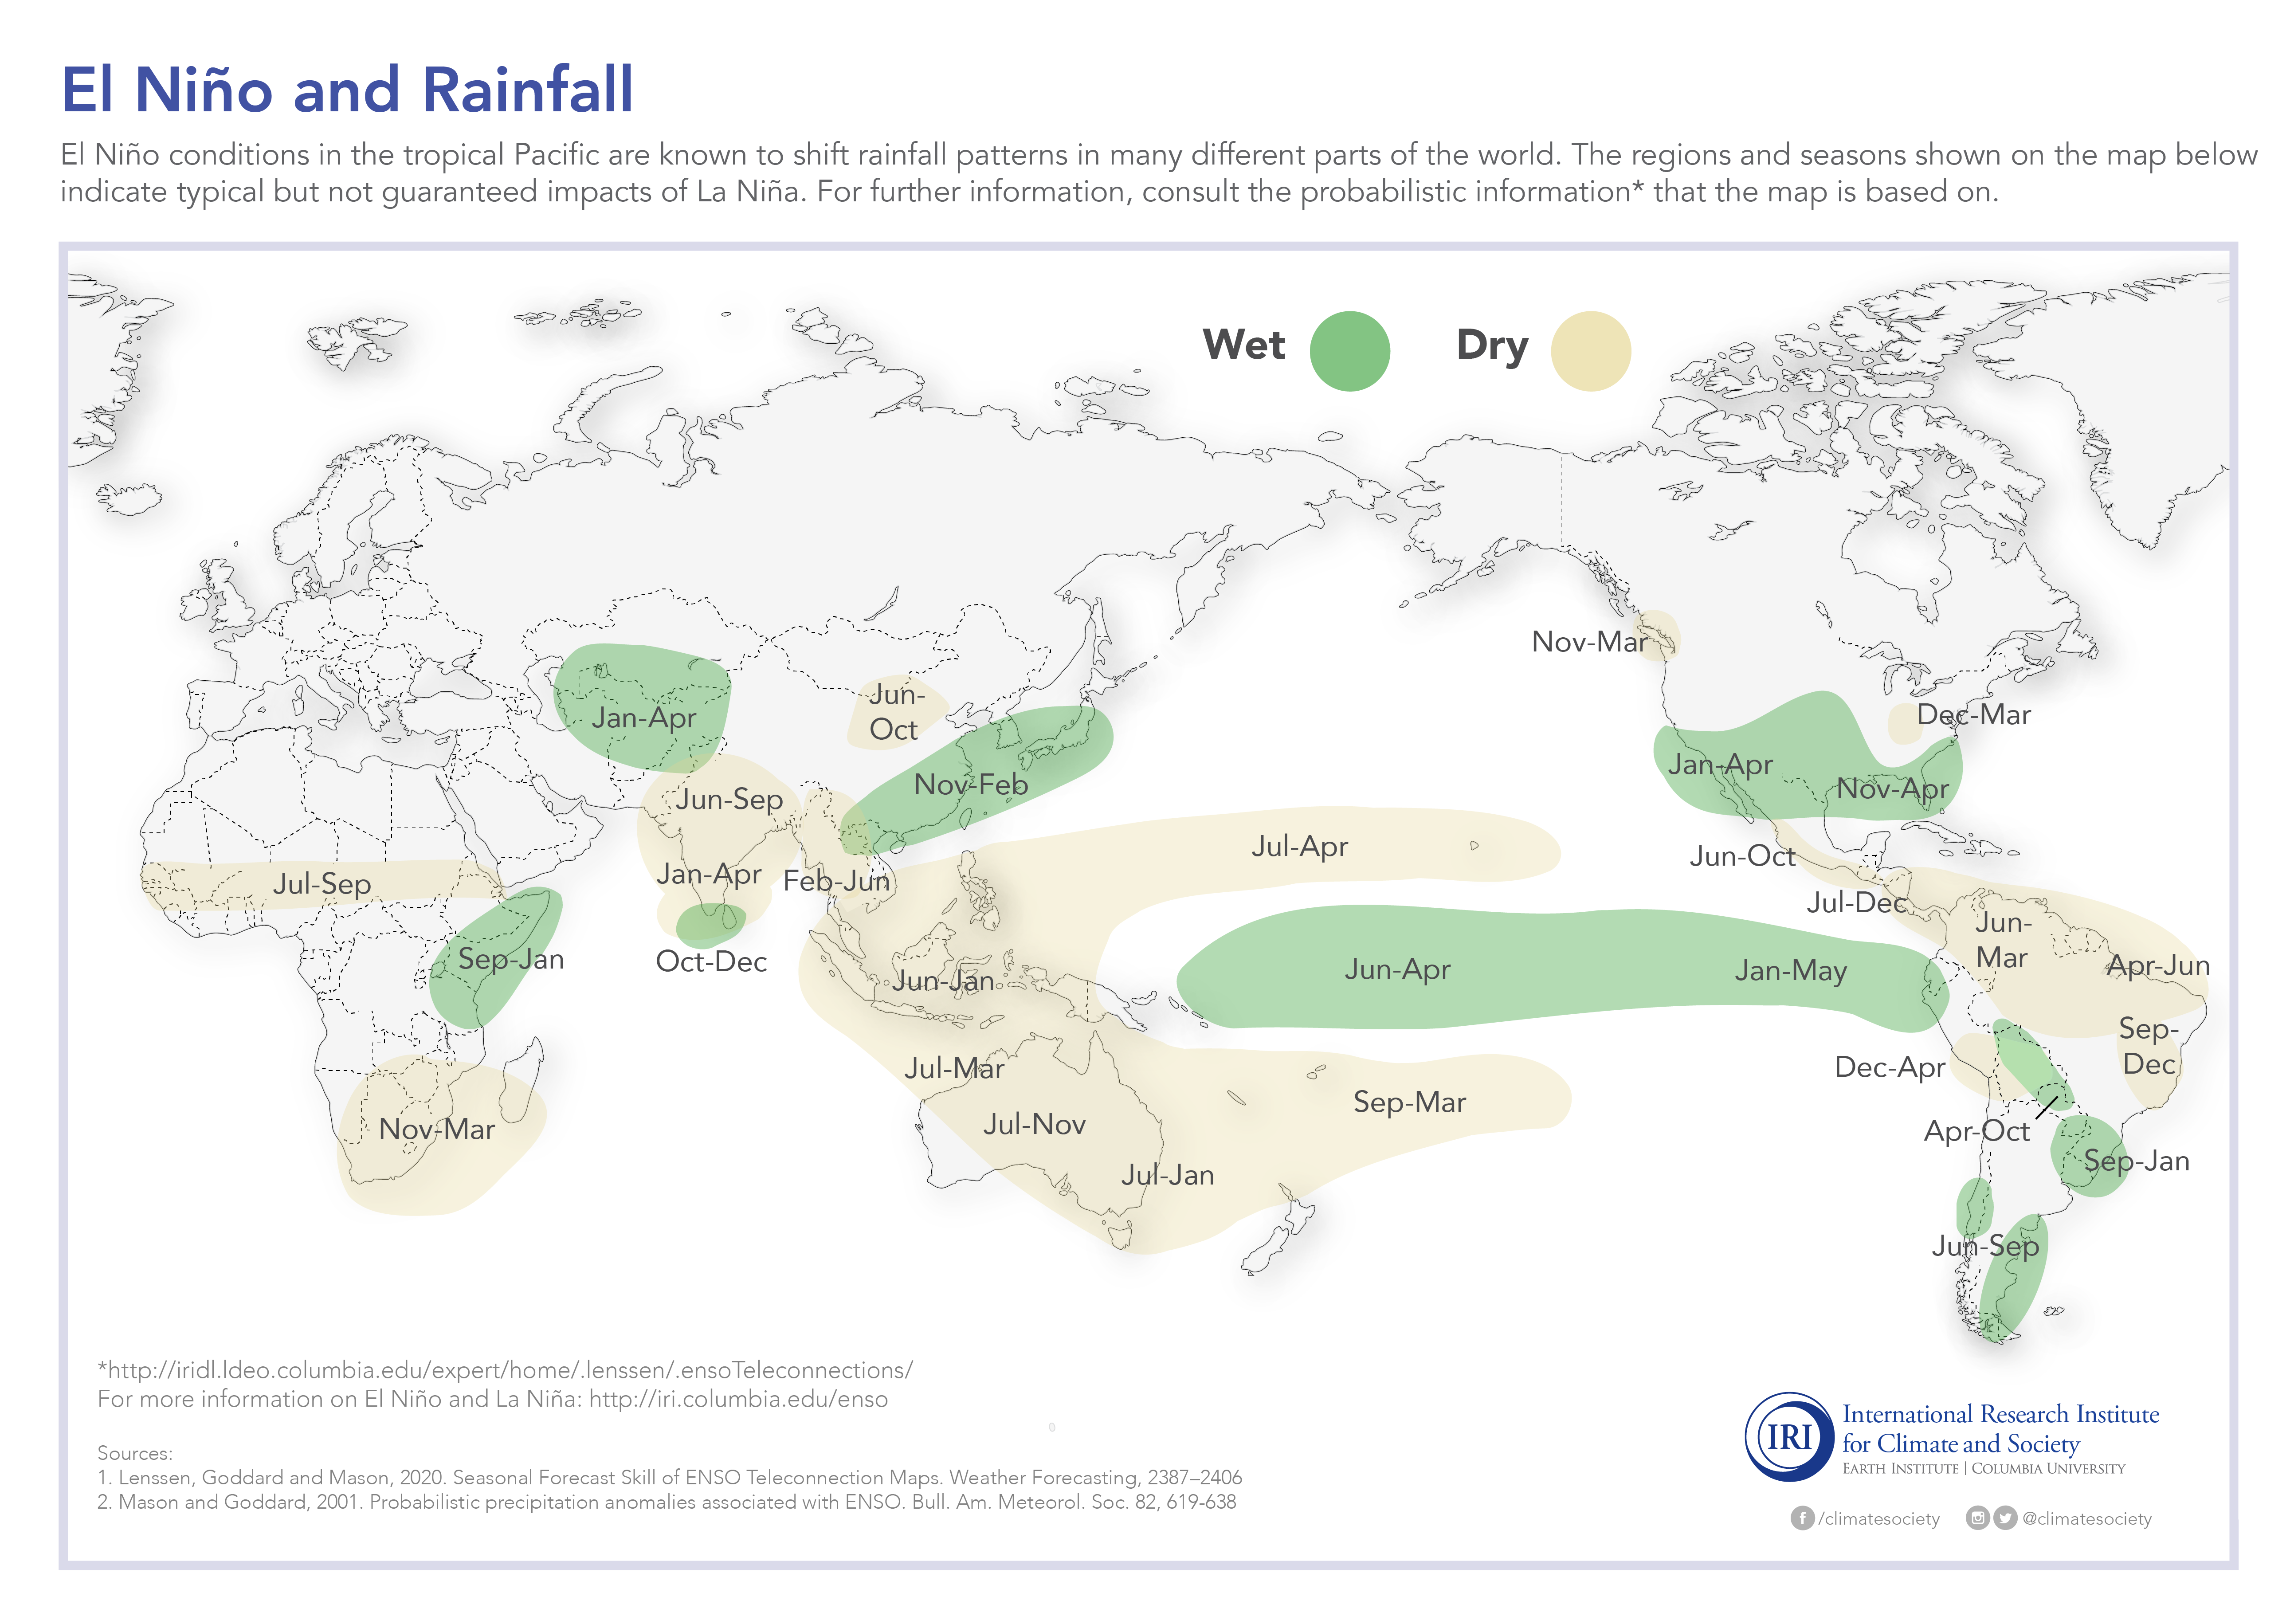
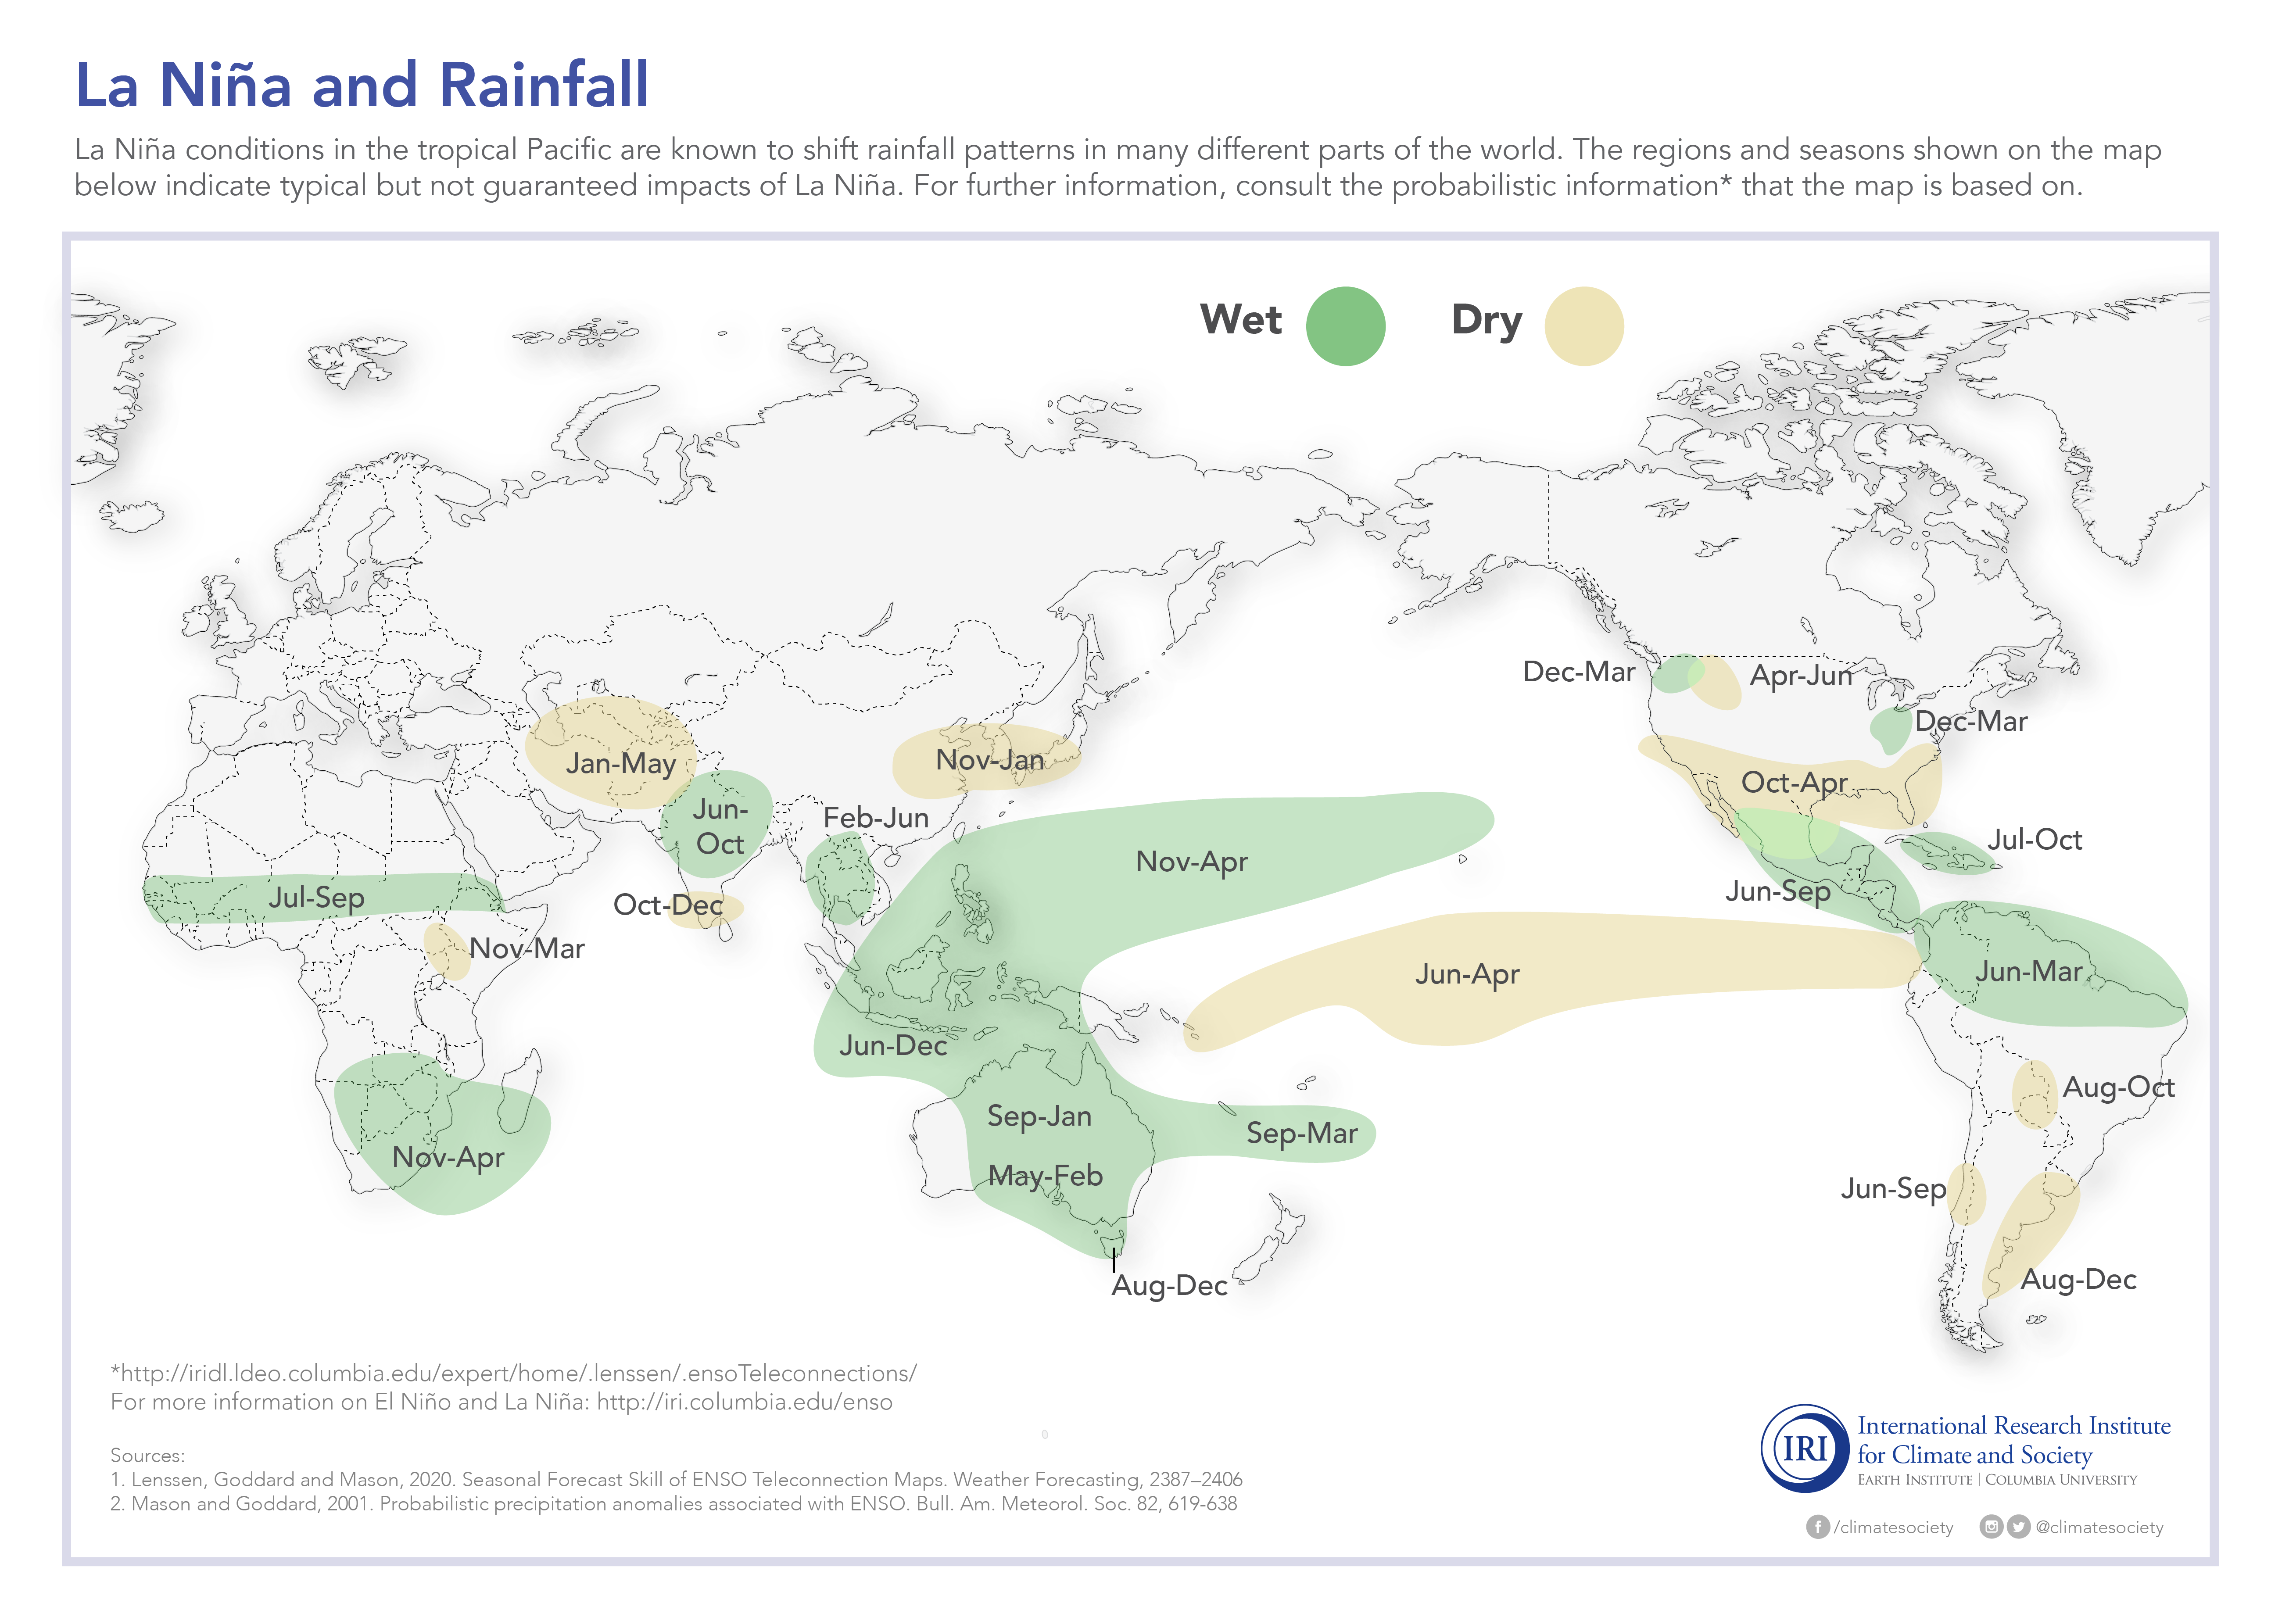
- Past Conditions: These maps show rainfall patterns that can be expected for El Nino, La Nina, and average years.
- Recent Climate Trends: These maps show what the rainfall has been like for the last 100 years, and what trends exist in your location.
- Vulnerability Indicators: These maps show population density and child mortality rates to indicate areas of the world that might be most vulnerable to high or low rainfall amounts.

+psdef//antialias+true+psdef//color_smoothing+null+psdef//apcp/0/300/plotrange/S/last/plotvalue//plotborder+0+psdef+.gif)
+psdef//antialias+true+psdef//color_smoothing+null+psdef//apcp/0/300/plotrange/S/last/plotvalue//plotborder+0+psdef+.gif)
+psdef//antialias+true+psdef//color_smoothing+null+psdef//apcp/0/300/plotrange/S/last/plotvalue//plotborder+0+psdef+.gif)


